


Electricity prices in Europe have become one of the most important household and business concerns in recent years. The energy crisis, geopolitical tensions, the war, changing gas supplies, grid investment, taxes, levies and the growth of renewable energy have all reshaped the market. Although prices have eased from the most extreme crisis levels, many European households still pay much more for electricity than they did before 2022.
A household in Ireland, Germany or Belgium may face a very different electricity bill from one in Hungary, Malta or Bulgaria. When purchasing power is considered, countries such as Romania, Czechia and Poland can feel the strongest pressure, even if their euro price per kWh is not always the highest.
This article looks at the current electricity price situation in Europe from several angles and distribution costs, and practical ways to reduce electricity bills. It also explains how solar energy, dynamic tariffs and portable solar power solutions such as Jackery Solar Generators can help households use energy more flexibly and rely less on expensive grid electricity.
|
Key Takeaways: |
|
Energy Market in Europe: Where Things Stand Today
Europe’s energy market has changed sharply in the past few years. What used to be seen mainly as a question of price and supply is now closely linked to politics, security, climate policy and household cost-of-living pressure. For many European countries, energy is no longer just a utility bill. It has become a strategic issue.
The biggest turning point was Russia’s full-scale invasion of Ukraine in 2022. Before that, many European economies relied heavily on Russian pipeline gas, especially for heating, industry and electricity generation. Since then, Europe has worked to reduce this dependence.
This shift has made Europe’s gas supply more diverse, but also more exposed to global markets. Instead of relying mainly on pipelines from Russia, Europe now imports more liquefied natural gas, especially from the United States, Norway, Qatar and other suppliers.
Electricity prices remain strongly connected to gas prices. Even though renewables are growing quickly, gas-fired power plants still often set the marginal electricity price in many European markets. This means that when gas becomes more expensive, electricity prices can rise too, even in countries with a high share of wind, solar, hydro or nuclear power. In 2025, the average EU wholesale electricity price rose by around 10% year on year to about USD 95/MWh, broadly in line with higher gas prices at the Dutch TTF hub. (Data Source: IEA)
For households, the picture is mixed. Some countries have seen prices ease from the extreme peaks of the 2022 energy crisis, but bills remain high compared with the pre-crisis period. In Q2 2025, retail electricity prices for households in EU capital cities rose by 3% to 246 €/MWh, even though the energy component itself decreased in some places. Network costs, taxes and national policy choices now play a larger role in what people actually pay.
At the same time, Europe is trying to speed up the energy transition. Solar, wind, batteries, heat pumps, smart meters and home energy storage are no longer niche technologies.
Electricity Prices for Household Consumers in the EU
Household electricity prices in the EU have calmed compared with the worst period of the 2022 energy crisis, but they are still high by long-term standards.
In the second half of 2025, the average EU household electricity price was €0.2896 per kWh, or €28.96 per 100 kWh, including taxes and levies. This was only slightly higher than the first half of 2025, but still well above pre-crisis levels. A simple way to see the current EU average is:
EU household electricity price, including taxes

The increase in 2025 was not mainly caused by a rise in the underlying energy price. Eurostat data shows that pre-tax household electricity prices continued to ease slightly in the second half of 2025, reaching €0.2059 per kWh. However, taxes and levies rose to €0.0837 per kWh, making up 28.9% of the final household bill.
Which EU Countries Have the Highest Household Electricity Prices?
In the second half of 2025, Ireland had the highest household electricity price in the EU, at €0.4042 per kWh. It was followed by Germany at €0.3869 per kWh, Belgium at €0.3499 per kWh, and Denmark at €0.3312 per kWh. These figures refer to the standard household consumption band of 2,500–4,999 kWh per year, which Eurostat commonly uses for household comparisons.
|
Rank |
Country |
Household electricity price, H2 2025 |
|
1 |
Ireland |
€0.4042/kWh |
|
2 |
Germany |
€0.3869/kWh |
|
3 |
Belgium |
€0.3499/kWh |
|
4 |
Denmark |
€0.3312/kWh |
|
EU average |
EU |
€0.2896/kWh |
Ireland’s price was around 40% above the EU average, which makes electricity affordability a bigger issue for Irish households than in many other EU markets.
Which EU Countries Have the Lowest Household Electricity Prices?
At the other end of the table, Hungary had the lowest household electricity price in the EU in the second half of 2025, at €0.1082 per kWh. It was followed by Malta at €0.1282 per kWh and Bulgaria at €0.1355 per kWh. Households in these countries paid less than half the EU average price.
|
Rank |
Country |
Household electricity price, H2 2025 |
|
1 |
Hungary |
€0.1082/kWh |
|
2 |
Malta |
€0.1282/kWh |
|
3 |
Bulgaria |
€0.1355/kWh |
|
EU average |
EU |
€0.2896/kWh |
This gap shows why “European electricity prices” should not be treated as one single market reality. A household in Ireland or Germany may face a very different bill from a household in Hungary, Malta or Bulgaria, even with similar electricity use.
Where Did Electricity Prices Grow Fastest?
The fastest increase came from Romania, where household electricity prices rose by 58.6% in the second half of 2025 compared with the same period in 2024. Austria followed with a 34.3% increase, while Ireland rose by 32.7%. Eurostat links these increases mainly to network costs and the reduction of subsidies or allowances introduced during the energy crisis.
|
Country |
Year-on-year change, H2 2025 vs H2 2024 |
|
Romania |
+58.6% |
|
Austria |
+34.3% |
|
Ireland |
+32.7% |
Romania is a good example of how policy changes can quickly affect household bills. Price caps and support measures can hold bills down temporarily, but once they are reduced or removed, consumers may feel the change very sharply.
Where Did Prices Fall the Most?
Not every EU country saw higher household electricity prices. The biggest fall was in Cyprus, where prices dropped by 14.7% year on year. France followed with a 12.5% fall, while Denmark saw prices fall by 11.9%.
|
Country |
Year-on-year change, H2 2025 vs H2 2024 |
|
Cyprus |
-14.7% |
|
France |
-12.5% |
|
Denmark |
-11.9% |
For households, this means the direction of electricity prices depends heavily on national energy mixes, government policy, network charges, taxes and supplier pricing structures. A fall in wholesale electricity costs does not always translate directly into a lower final bill.
Household Electricity Prices by Consumption Group
Eurostat divides household electricity prices into five annual consumption bands. These bands are useful because households do not all use electricity in the same way. A small apartment with gas heating may consume less than 1,000 kWh per year, while an all-electric home with heat pumps, EV charging or large appliances may use much more.
The standard EU comparison most often uses the 2,500–4,999 kWh band, where the EU average in the second half of 2025 was €0.2896/kWh. Eurostat notes that household prices include the basic electricity price, transmission and distribution charges, meter rental, other services, taxes, levies and VAT.
|
Household consumption group |
Eurostat band |
Typical household profile |
Price interpretation |
|
Less than 1,000 kWh/year |
Band DA |
Very low-use household, second home, small flat, or household using other fuels for heating and cooking |
Per-kWh prices can look high because fixed charges are spread over very low consumption. |
|
1,000–2,499 kWh/year |
Band DB |
Small apartment, one-person household, efficient household with limited electric heating |
Often sensitive to standing charges, taxes and supplier tariffs. |
|
2,500–4,999 kWh/year |
Band DC |
Standard household comparison band |
EU benchmark in H2 2025: €0.2896/kWh. |
|
5,000–14,999 kWh/year |
Band DD |
Larger household, electric cooking, more appliances, partial electric heating or EV charging |
Unit prices may be lower than low-use bands, but total annual bills are much higher. |
|
15,000 kWh/year or more |
Band DE |
Very high-use household, all-electric home, large property, heat pump plus EV charging |
Often more exposed to tariff design, peak pricing and network charges. |
The main point is simple: a lower price per kWh does not always mean a lower bill. Larger consumers may sometimes pay a lower unit rate because fixed costs are spread across more kWh, but their annual electricity bill can still be much higher. Smaller consumers may see a higher effective unit price because standing charges, taxes and network costs weigh more heavily on each kWh used.
The Impact of Taxes and Levies Differs Greatly between EU Countries
Taxes and levies are one of the biggest reasons household electricity prices vary so widely across Europe. The electricity price shown on a household bill is not only the cost of generating or buying power. It usually includes the energy component, grid and distribution charges, VAT, renewable energy levies, policy costs, meter-related fees and sometimes crisis-era subsidies or allowances.
In the second half of 2025, the average EU household electricity price was €0.2896/kWh. Of this, €0.0837/kWh came from taxes and levies, meaning taxes made up 28.9% of the final household electricity price. This was higher than the 27.9% share recorded in the first half of 2025, mainly because some temporary subsidies and allowances were reduced.
EU household electricity price, H2 2025
 Tax share of final price: 28.9%
This matters because even when the underlying electricity cost falls, the final price paid by households may still rise. In H2 2025, Eurostat reported that the pre-tax electricity price fell slightly, but the final price increased because taxes and levies rose. (Data Source: European Commission)
Countries with the Highest Tax and Levy Share
The tax burden is not the same across the EU. In H2 2025, Denmark had the highest tax and levy share, with taxes making up 49.1% of the final household electricity price. In simple terms, almost half of the Danish household electricity bill came from VAT and other taxes or levies.
A high tax share does not always mean the country has the highest electricity price overall, but it does mean government policy plays a large role in the bill. Denmark is a clear example: its household electricity price is high, and taxes and levies are a major part of that cost.
Countries with Negative Tax Shares: Luxembourg and the Netherlands
At the other end of the scale, Luxembourg and the Netherlands had negative tax and levy shares in H2 2025: -6.3% and -5.2% respectively. This happens when subsidies, allowances or support measures are larger than the taxes and levies charged to households.
A negative tax share does not mean households pay no taxes at all. It means the final electricity price is being reduced by public support or compensation mechanisms. These measures can make bills look much lower in the short term, but they are policy-dependent and may change when government budgets or energy market conditions shift.
|
Country / Area |
Tax and levy share in household electricity price, H2 2025 |
What it means |
|
Denmark |
49.1% |
Taxes and levies form almost half of the household electricity bill. |
|
EU average |
28.9% |
Around three-tenths of the final bill comes from taxes and levies. |
|
Netherlands |
-5.2% |
Subsidies or allowances more than offset taxes and levies. |
|
Luxembourg |
-6.3% |
Public support reduces the final household price below the pre-tax level. |
VAT Also Varies Widely
VAT is another important part of the household electricity bill. Across the EU, VAT represented 15.2% of the final household electricity price in H2 2025. However, the range was wide: from 4.8% in Malta to 21.3% in Hungary.
This means two households with similar electricity use can face very different final prices depending on national VAT rules. Some countries use reduced VAT rates or temporary tax cuts to ease pressure on households, while others apply a higher standard VAT rate.
VAT is especially important because it is applied broadly and directly affects almost every household. Unlike some levies that may target specific policy costs, VAT usually appears as a general tax on final consumption.
Electricity Prices in Purchasing Power Standard (PPS)
Electricity prices in Europe show how much households pay on the bill. Purchasing Power Standard, or PPS, shows how expensive that electricity feels after adjusting for the general cost of living in each country.
This is useful because €0.30/kWh does not have the same weight everywhere in Europe. In a country with higher average wages and higher price levels, that cost may be easier to absorb. In a country with lower purchasing power, a lower euro price can still feel expensive for households.
Eurostat uses PPS to compare electricity prices more fairly across countries. In the second half of 2025, household electricity prices in PPS were measured for the standard household consumption band of 2,500–5,000 kWh per year. The prices are shown as PPS per 100 kWh.
Highest Electricity Prices in PPS
In PPS terms, Romania had the highest household electricity price in the EU, at 49.52 PPS per 100 kWh. It was followed by Czechia at 38.65 PPS and Poland at 37.15 PPS.
Highest household electricity prices in PPS, H2 2025
PPS per 100 kWh

This ranking is different from the euro-price ranking. In euros per kWh, Ireland and Germany were among the most expensive countries. But after adjusting for purchasing power, Romania moves to the top. This means electricity places a heavier relative burden on Romanian households than the euro price alone would suggest.
Lowest Electricity Prices in PPS
The lowest PPS-adjusted household electricity prices were found in Malta, Hungary and Finland. Malta recorded 14.09 PPS per 100 kWh, Hungary 15.10 PPS, and Finland 18.77 PPS.
Lowest household electricity prices in PPS, H2 2025
PPS per 100 kWh

Finland is especially interesting because it does not have the very lowest euro price in the EU, but electricity is relatively affordable when adjusted for purchasing power. Hungary also appears low in both euro terms and PPS terms, making it one of the least expensive household electricity markets in the EU by these measures.
PPS Changes the Story Compared with Euro Prices
PPS is helpful because it reveals the difference between nominal price and real household affordability.
|
Metric |
Highest countries |
Lowest countries |
What this tells us |
|
Electricity price in euros |
Ireland, Germany, Belgium |
Hungary, Malta, Bulgaria |
Shows the direct bill price paid per kWh. |
|
Electricity price in PPS |
Romania, Czechia, Poland |
Malta, Hungary, Finland |
Shows how heavy electricity costs feel compared with local purchasing power. |
A household in Germany may pay one of the highest euro prices in Europe, but German purchasing power is also relatively high. A household in Romania may pay a lower euro price than Germany, but electricity can feel more expensive compared with local incomes and price levels.
Share of Transmission and Distribution Costs for Household Electricity Consumers
Transmission and distribution costs are the network part of the household electricity bill in Europe. They pay for moving electricity from power stations, wind farms, solar parks and interconnectors to homes.
They are different from the energy price itself. The wholesale electricity price may fall, but households can still face high bills if the grid needs expensive upgrades, maintenance or balancing.

Eurostat’s latest available data for this metric is for 2025. It shows that distribution costs are usually much larger than transmission costs for household consumers. This is normal because most households are connected to the local distribution network, not directly to the high-voltage transmission grid. Distribution networks are denser, more local and more complex at street level.
- Transmission costs cover the high-voltage network that moves large volumes of electricity over long distances. This part of the system connects large generation sources, interconnectors and regional grid zones.
- Distribution costs cover the lower-voltage local networks that deliver electricity to homes, apartment buildings and small businesses. These costs include local cables, substations, transformers, metering-related infrastructure and local grid maintenance.
Countries with the Highest Distribution Cost Share
In 2025, Luxembourg had the highest distribution cost share, at 100.0% of household electricity network costs. This means the reported network cost for household consumers was entirely allocated to distribution rather than transmission.
It was followed by Slovakia, where distribution represented 91.5%, and Finland, where it represented 90.0%.
|
Country |
Distribution share of network costs |
Transmission share |
|
Luxembourg |
100.0% |
0.0% |
|
Slovakia |
91.5% |
8.5% |
|
Finland |
90.0% |
10.0% |
Luxembourg is a special case because of its small size and dense grid structure. Smaller, densely populated countries often rely heavily on their distribution network for household delivery. Finland is different: it is geographically large, but household network-cost allocation still shows distribution as the dominant component.
Countries with the Highest Transmission Cost Share
Some countries have a much higher transmission share. In 2025, Lithuania had the highest transmission cost share, at 43.5%. Estonia followed with 33.0%, and Denmark with 32.0%.
|
Country |
Transmission share of network costs |
Distribution share |
|
Lithuania |
43.5% |
56.5% |
|
Estonia |
33.0% |
67.0% |
|
Denmark |
32.0% |
68.0% |
A higher transmission share can reflect the structure of the electricity system, population density, geography, generation location and the need to move power across longer distances. Eurostat notes that countries with lower population density may require a more extensive transmission network, which can increase transmission-related costs.
Electricity Prices for Non-Household Consumers in the Europe
Non-household electricity consumers include businesses, factories, offices, shops, public buildings and other organisations that buy electricity for professional use. Eurostat usually compares this group using the annual consumption band of 500 MWh to 2,000 MWh, which is a useful benchmark for medium-sized commercial and industrial users.
In the second half of 2025, the average EU electricity price for non-household consumers was €18.37 per 100 kWh, or €0.1837/kWh, including non-recoverable taxes and levies. This was down from €19.03 per 100 kWh in the first half of 2025, a decrease of 3.5%. Prices have generally moved downward since the first half of 2023, when the EU average reached €21.51 per 100 kWh.
EU non-household electricity prices

The trend is important for European businesses. Energy costs are lower than at the peak of the crisis, but they are still high enough to affect competitiveness, production costs and investment decisions. For energy-intensive sectors, even a small change in the electricity price can influence operating margins.
Highest Non-Household Electricity Prices in the EU
In the second half of 2025, Ireland had the highest electricity price for non-household consumers, at €25.52 per 100 kWh. It was followed by Cyprus at €24.29 per 100 kWh and Germany at €22.64 per 100 kWh.
|
Rank |
Country |
Non-household electricity price, H2 2025 |
|
1 |
Ireland |
€25.52/100 kWh |
|
2 |
Cyprus |
€24.29/100 kWh |
|
3 |
Germany |
€22.64/100 kWh |
|
EU average |
EU |
€18.37/100 kWh |
Ireland’s business electricity price was about 39% higher than the EU average, while Cyprus was around 32% higher. For companies operating in these markets, electricity is a more direct cost pressure than in many northern or eastern European countries.
Lowest Non-Household Electricity Prices in the EU
The lowest non-household electricity prices were recorded in Finland and Sweden. Finland had the lowest price at €7.48 per 100 kWh, followed by Sweden at €9.70 per 100 kWh.
|
Rank |
Country |
Non-household electricity price, H2 2025 |
|
1 |
Finland |
€7.48/100 kWh |
|
2 |
Sweden |
€9.70/100 kWh |
|
EU average |
EU |
€18.37/100 kWh |
Finland’s non-household electricity price was less than half the EU average. This is a major advantage for businesses with high electricity demand, especially in sectors such as manufacturing, data processing, cold storage and electrified industrial processes.
Where Did Prices Fall the Most?
Across the EU, non-household electricity prices fell in 18 countries in the second half of 2025 compared with the same period in 2024. The largest decreases were recorded in Slovenia at -16.6%, Luxembourg at -15.8%, and France at -14.1%.
|
Country |
Change in non-household electricity price, H2 2025 vs H2 2024 |
|
Slovenia |
-16.6% |
|
Luxembourg |
-15.8% |
|
France |
-14.1% |
This shows that business electricity costs are easing in many countries, but not evenly. National energy mixes, grid charges, taxes, support schemes and contract structures all affect how quickly lower wholesale prices reach companies.
Where Did Prices Increase?
Five EU countries recorded higher non-household electricity prices in H2 2025 compared with H2 2024. The fastest increase was in Romania, where prices rose by 15.4%. It was followed by Sweden at +9.4%, Bulgaria at +6.8%, Belgium at +2.8%, and Slovakia at +1.4%.
|
Country |
Change in non-household electricity price, H2 2025 vs H2 2024 |
|
Romania |
+15.4% |
|
Sweden |
+9.4% |
|
Bulgaria |
+6.8% |
|
Belgium |
+2.8% |
|
Slovakia |
+1.4% |
Sweden is interesting because it still had one of the lowest absolute prices in Europe, even though its price increased year on year. This is why it is useful to look at both the price level and the rate of change.
Non-Household vs Household Electricity Prices
Non-household electricity prices are usually lower than household prices per kWh, mainly because larger consumers often buy electricity under different tariff structures and spread fixed costs across higher consumption. In H2 2025, the EU average household electricity price was €28.96 per 100 kWh, while the non-household average was €18.37 per 100 kWh.
|
Consumer type |
EU average electricity price, H2 2025 |
|
Household consumers |
€28.96/100 kWh |
|
Non-household consumers |
€18.37/100 kWh |
However, lower unit prices do not mean lower total costs. A business using hundreds or thousands of MWh per year can have a much larger annual electricity bill than a household, even with a lower price per kWh.
How to Save Your Electricity Bills in Household?
Electricity prices in Europe are no longer at the extreme crisis levels of 2022, but household bills remain high. In the second half of 2025, the average EU household electricity price was €0.2896/kWh, and taxes and levies made up 28.9% of the final bill. That means saving electricity is not only about using fewer kWh. It is also about using power more intelligently, reducing waste and depending less on expensive grid electricity where possible.
Tip 1: Make Full Use of Dynamic Electricity Tariffs
Dynamic tariffs allow the electricity price to change by hour or by market period. When wholesale prices are lower, usually during times of high renewable generation or lower demand, households can shift flexible tasks to cheaper hours.
This works especially well for appliances that do not need to run immediately, such as:
|
Flexible load |
How to save with a dynamic tariff |
|
Washing machine |
Run during low-price hours instead of evening peaks. |
|
Dishwasher |
Schedule overnight or midday, depending on tariff signals. |
|
EV charging |
Charge when prices are lowest, not automatically after work. |
|
Heat pump |
Pre-heat slightly during cheaper hours where suitable. |
|
Home battery |
Charge when electricity is cheap and discharge when prices rise. |
Dynamic tariffs are not perfect for every household. They usually work best when you have a smart meter, flexible appliances, or a battery system that can respond automatically.
They can also carry risk if peak prices rise sharply, so households should check the tariff terms carefully before switching. The European Commission has also highlighted the need for clear and comparable energy contracts as tariffs become more complex.
Tip 2: Choose Solar Energy and Use More of It Yourself
Solar panels remain one of the most effective ways to reduce grid electricity use, especially in countries with high daytime electricity prices. The biggest benefit comes from self-consumption: using your own solar power directly at home instead of exporting it cheaply and buying electricity back later at a higher retail price.
The European Commission estimates that households or businesses producing and self-consuming their own solar energy can save around €260 to €550 per year on energy bills. Energy communities that share wind and solar power can save even more, depending on the local setup.
Tip 3: Reduce Standby Power and Hidden Consumption
Many homes waste electricity through standby devices. TVs, game consoles, chargers, coffee machines, speakers, routers, set-top boxes and office equipment may continue drawing power even when they are not actively used.
The easiest fix is to group devices with smart plugs or switchable power strips. Turn off what you do not need overnight or while you are away. This is a small habit, but it adds up over a year, especially in households with many connected devices.
A smart plug can also help identify which appliances are quietly using electricity in the background. Once you know where the waste is, it becomes much easier to cut it.
Tip 4: Shift Energy-Heavy Appliances Away from Peak Hours
Even without a dynamic tariff, many European households can save by avoiding unnecessary peak-time use. Evening demand is often high because people cook, wash clothes, watch TV, charge devices and heat their homes at the same time.
Where your tariff rewards off-peak use, try moving larger loads away from the evening. Washing machines, tumble dryers, dishwashers and EV chargers are usually the easiest to shift.
|
Appliance |
Better saving habit |
|
Washing machine |
Wash full loads and use eco mode. |
|
Tumble dryer |
Use only when needed; air-dry when possible. |
|
Dishwasher |
Run full and use the eco programme. |
|
Oven |
Batch-cook when practical. |
|
EV charger |
Schedule charging outside expensive hours. |
This does not mean changing your whole lifestyle. It simply means moving the flexible loads first.
Tip 5: Improve Heating, Cooling and Hot Water Efficiency
In many European homes, the largest energy costs are linked to heating, cooling and hot water. Even if your heating uses gas, oil or district heating, electricity can still be involved through pumps, controls, ventilation, heat pumps or electric water heating.
Practical steps include lowering the thermostat slightly, using timers, improving insulation, sealing draughts and setting hot-water systems correctly. For households using heat pumps, smart scheduling can be especially useful because the system may be able to run more during cheaper electricity periods while keeping the home comfortable.
Tip 6: Upgrade Old and Inefficient Appliances
Older appliances can use much more electricity than modern efficient models. Fridges, freezers, washing machines, dryers and electric heaters are worth checking first because they either run often or consume a lot of power when switched on.
When replacing an appliance, check the EU energy label carefully. The cheapest product is not always the cheapest to own. A more efficient fridge or washing machine may cost more upfront but save money every year.
Tip 7: Monitor Your Electricity Use Regularly
You cannot manage what you cannot see. Smart meters, supplier apps, plug-in energy monitors and home energy management systems can show when your household uses the most electricity.
This is useful because many people underestimate evening peaks and standby consumption. Once you can see your daily pattern, you can decide whether solar, a battery, a dynamic tariff or simple habit changes will save the most money.
Tip 8: Use a Portable Power Solution at Home
A portable power station can be useful for households that want flexible backup power without installing a full fixed home battery system. It can support essential devices during short outages, power equipment in a garage, garden or balcony setup, and work alongside portable solar panels for extra independence.
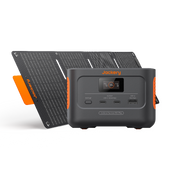
A Jackery Solar Generator combines a portable power station with solar charging, making it a practical option for European households that want a cleaner and quieter alternative to fuel generators. It can help run everyday essentials such as phones, laptops, routers, lights, small kitchen appliances and outdoor devices, depending on the model and capacity.
|
Home use case |
How a Jackery Solar Generator can help |
|
Power outage |
Keeps essential devices running for a limited period. |
|
Home office backup |
Supports laptop, router and phone charging. |
|
Balcony or garden use |
Provides portable power without extension cables. |
|
Solar charging |
Uses compatible solar panels to recharge during daylight. |
|
Flexible household power |
Moves between rooms, outdoor areas or travel use. |
For households that want portable backup, solar charging and everyday flexibility, a Jackery Solar Generator fits naturally into the way many Europeans now think about energy: use less, use smarter, and keep more control at home.
Jackery Solar Generators to Lower Your Electric Bills
A Jackery Solar Generator can help European households reduce electricity bills by replacing part of their grid electricity use with solar-generated power. It is not the same as a fixed rooftop solar and home battery system, but it can be a flexible, portable way to create, store and use clean electricity at home.
For many households, the most useful value is simple: generate electricity during daylight, store it in the power station, and use it later for everyday devices. This can reduce the amount of electricity bought from the grid, especially for home office equipment, phones, laptops, routers, lights, small appliances and outdoor power needs.
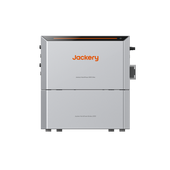
Jackery Solar Generator 3000 v2: Strong Home Backup and High-Power Daily Use
The Jackery Solar Generator 3000 v2 is suited to households that want a more powerful portable energy solution for home backup, off-grid use and larger daily loads. Its key strength is the balance between high capacity and strong AC output.

The Jackery Explorer 3000 v2 with 3,072Wh capacity, 3,600W pure sine wave output and 7,200W surge output. It includes multiple household-style outlets and USB ports, making it suitable for a wide range of home and outdoor devices.
|
Feature |
Jackery Solar Generator 3000 v2 |
|
Battery capacity |
3,072Wh |
|
AC output |
3,600W |
|
Surge output |
7,200W |
|
Best for |
Home backup, high-power portable use, off-grid support |
|
Typical household value |
Can support more demanding appliances and longer backup use |
How It Can Help Lower Electricity Bills?
The 3000 v2 is most useful when you want to cover larger electricity needs with stored solar energy. For example, it can power multiple smaller devices together or handle higher-wattage appliances for shorter periods. In a European household, this can be useful for:
|
Scenario |
Saving logic |
|
Home office day |
Run laptop, monitor, router and chargers from stored solar power. |
|
Evening device use |
Use solar-stored energy after sunset instead of peak grid power. |
|
Kitchen or utility use |
Support selected appliances depending on wattage and runtime. |
|
Backup use |
Avoid relying on fuel generators during short outages. |
|
Outdoor power |
Use solar-generated electricity in the garden, shed or balcony area. |
The 3000 v2 makes the most sense for households that want more than basic phone and laptop charging. It is better suited to users who want a serious portable backup option and enough output to support higher-demand home devices.
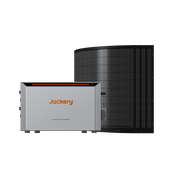
Jackery Solar Generator 1000 Plus: Expandable Solar Power for Flexible Use
The Jackery Solar Generator 1000 Plus is a good choice for households that want a scalable portable power system. Its biggest advantage is expandability: you can start with a smaller setup and increase storage capacity later if your needs grow.

The Jackery Solar Generator 1000 Plus as offering up to 2,000W output and an expandable capacity from around 1.25kWh to 5kWh. It also supports fast solar charging and uses long-life LiFePO4 battery technology.
|
Feature |
Jackery Solar Generator 1000 Plus |
|
Base capacity |
Around 1264Wh |
|
Expandable capacity |
Up to 5kWh |
|
Output |
Up to 2,000W |
|
Solar panel support |
Up to 2*SolarSaga 100W panels on supported bundle setups |
|
Best for |
Expandable backup, off-grid use, flexible home energy storage |
The 1000 Plus bundle also notes that up to four 200W solar panels can be connected, with the fastest full solar charge taking about 2 hours under suitable conditions.
How It Can Help Lower Electricity Bills?
The 1000 Plus is especially useful if your household wants to grow into solar storage gradually. You can use the base unit for daily devices and short backup needs, then expand the battery capacity if you need more stored energy.
|
Scenario |
Saving logic |
|
Start small |
Use the base system for phones, laptops, routers, lighting and small devices. |
|
Add capacity later |
Expand storage if your household uses more evening electricity. |
|
Pair with solar panels |
Generate and store more free solar electricity during daylight. |
|
Support off-grid use |
Useful for cabins, workshops, campervans or garden rooms. |
|
Backup essential loads |
Keep selected devices running during outages. |
The 1000 Plus is a strong option for households that want flexibility. It may be more attractive than a fixed battery for renters, small homes, weekend properties or users who want one power system for both home and travel.
FAQs
The following are the frequently asked questions about the cost of electricity in Europe:
1. Which EU country has the cheapest electricity?
Hungary had the cheapest household electricity in the EU in the second half of 2025, at €0.1082/kWh. Malta and Bulgaria were also among the lowest-priced countries.
2. How much does 1 kWh of electricity cost in Germany?
In the second half of 2025, household electricity in Germany cost around €0.3869/kWh for the standard household consumption band. That made Germany one of the most expensive EU countries for household electricity.
3. Who has the most expensive energy bills in Europe?
For household electricity in the EU, Ireland had the highest price in the second half of 2025, at €0.4042/kWh, around 40% above the EU average. Germany and Belgium followed among the highest-priced countries.
4. Is electricity cheaper in the US than Europe?
Yes, generally. The EU average household electricity price was €0.2896/kWh in the second half of 2025, while the US average residential electricity price was 17.65 cents/kWh in February 2026. Prices vary widely by country and US state, but average household electricity is usually cheaper in the US than in the EU.
Conclusion
Europe’s electricity market is no longer defined only by energy supply and demand. It is now shaped by geopolitics, national tax policy, grid investment, renewable energy growth and household behaviour. This is why electricity prices in Europe can differ so much between countries, and why the same amount of electricity can feel affordable in one market but expensive in another.
For households, the most practical response is to take more control over electricity use. Small changes such as reducing standby power, choosing efficient appliances and shifting flexible loads to cheaper hours can already make a difference. Larger steps, such as using solar energy, home storage or a portable solar generator, such as Jackery Solar Generator, can reduce reliance on the grid even further.


